Understanding Mean, Median, and Mode
Different ways to find the "average" serve different purposes. Understanding when to use each measure helps in accurate data analysis.
The Mean: A Balance Point
The mean represents the arithmetic average and considers all values in a dataset. It's calculated by summing all values and dividing by the count. The mean acts as a balance point for the data.
Best used when:
- Data is normally distributed
- All values should influence the result
- The dataset has few or no extreme values
Advanced Considerations:
- Geometric Mean vs Arithmetic Mean: For growth rates and ratios
- Weighted Mean: When values have different importance
- Harmonic Mean: For rates and speeds
The Median: The Middle Value
The median is the middle value when data is arranged in order. It divides the dataset into two equal halves, making it resistant to extreme values or outliers.
Best used when:
- Data is skewed
- Outliers are present
- A typical or middle value is needed
Statistical Properties:
- Robust to outliers (high breakdown point)
- Maintains ordinal properties
- Useful for ordinal data
The Mode: Most Frequent Value
The mode is the value that appears most often in a dataset. A dataset can have no mode, one mode, or multiple modes (multimodal).
Best used when:
- Working with categorical data
- Finding the most common value
- Analyzing frequency patterns
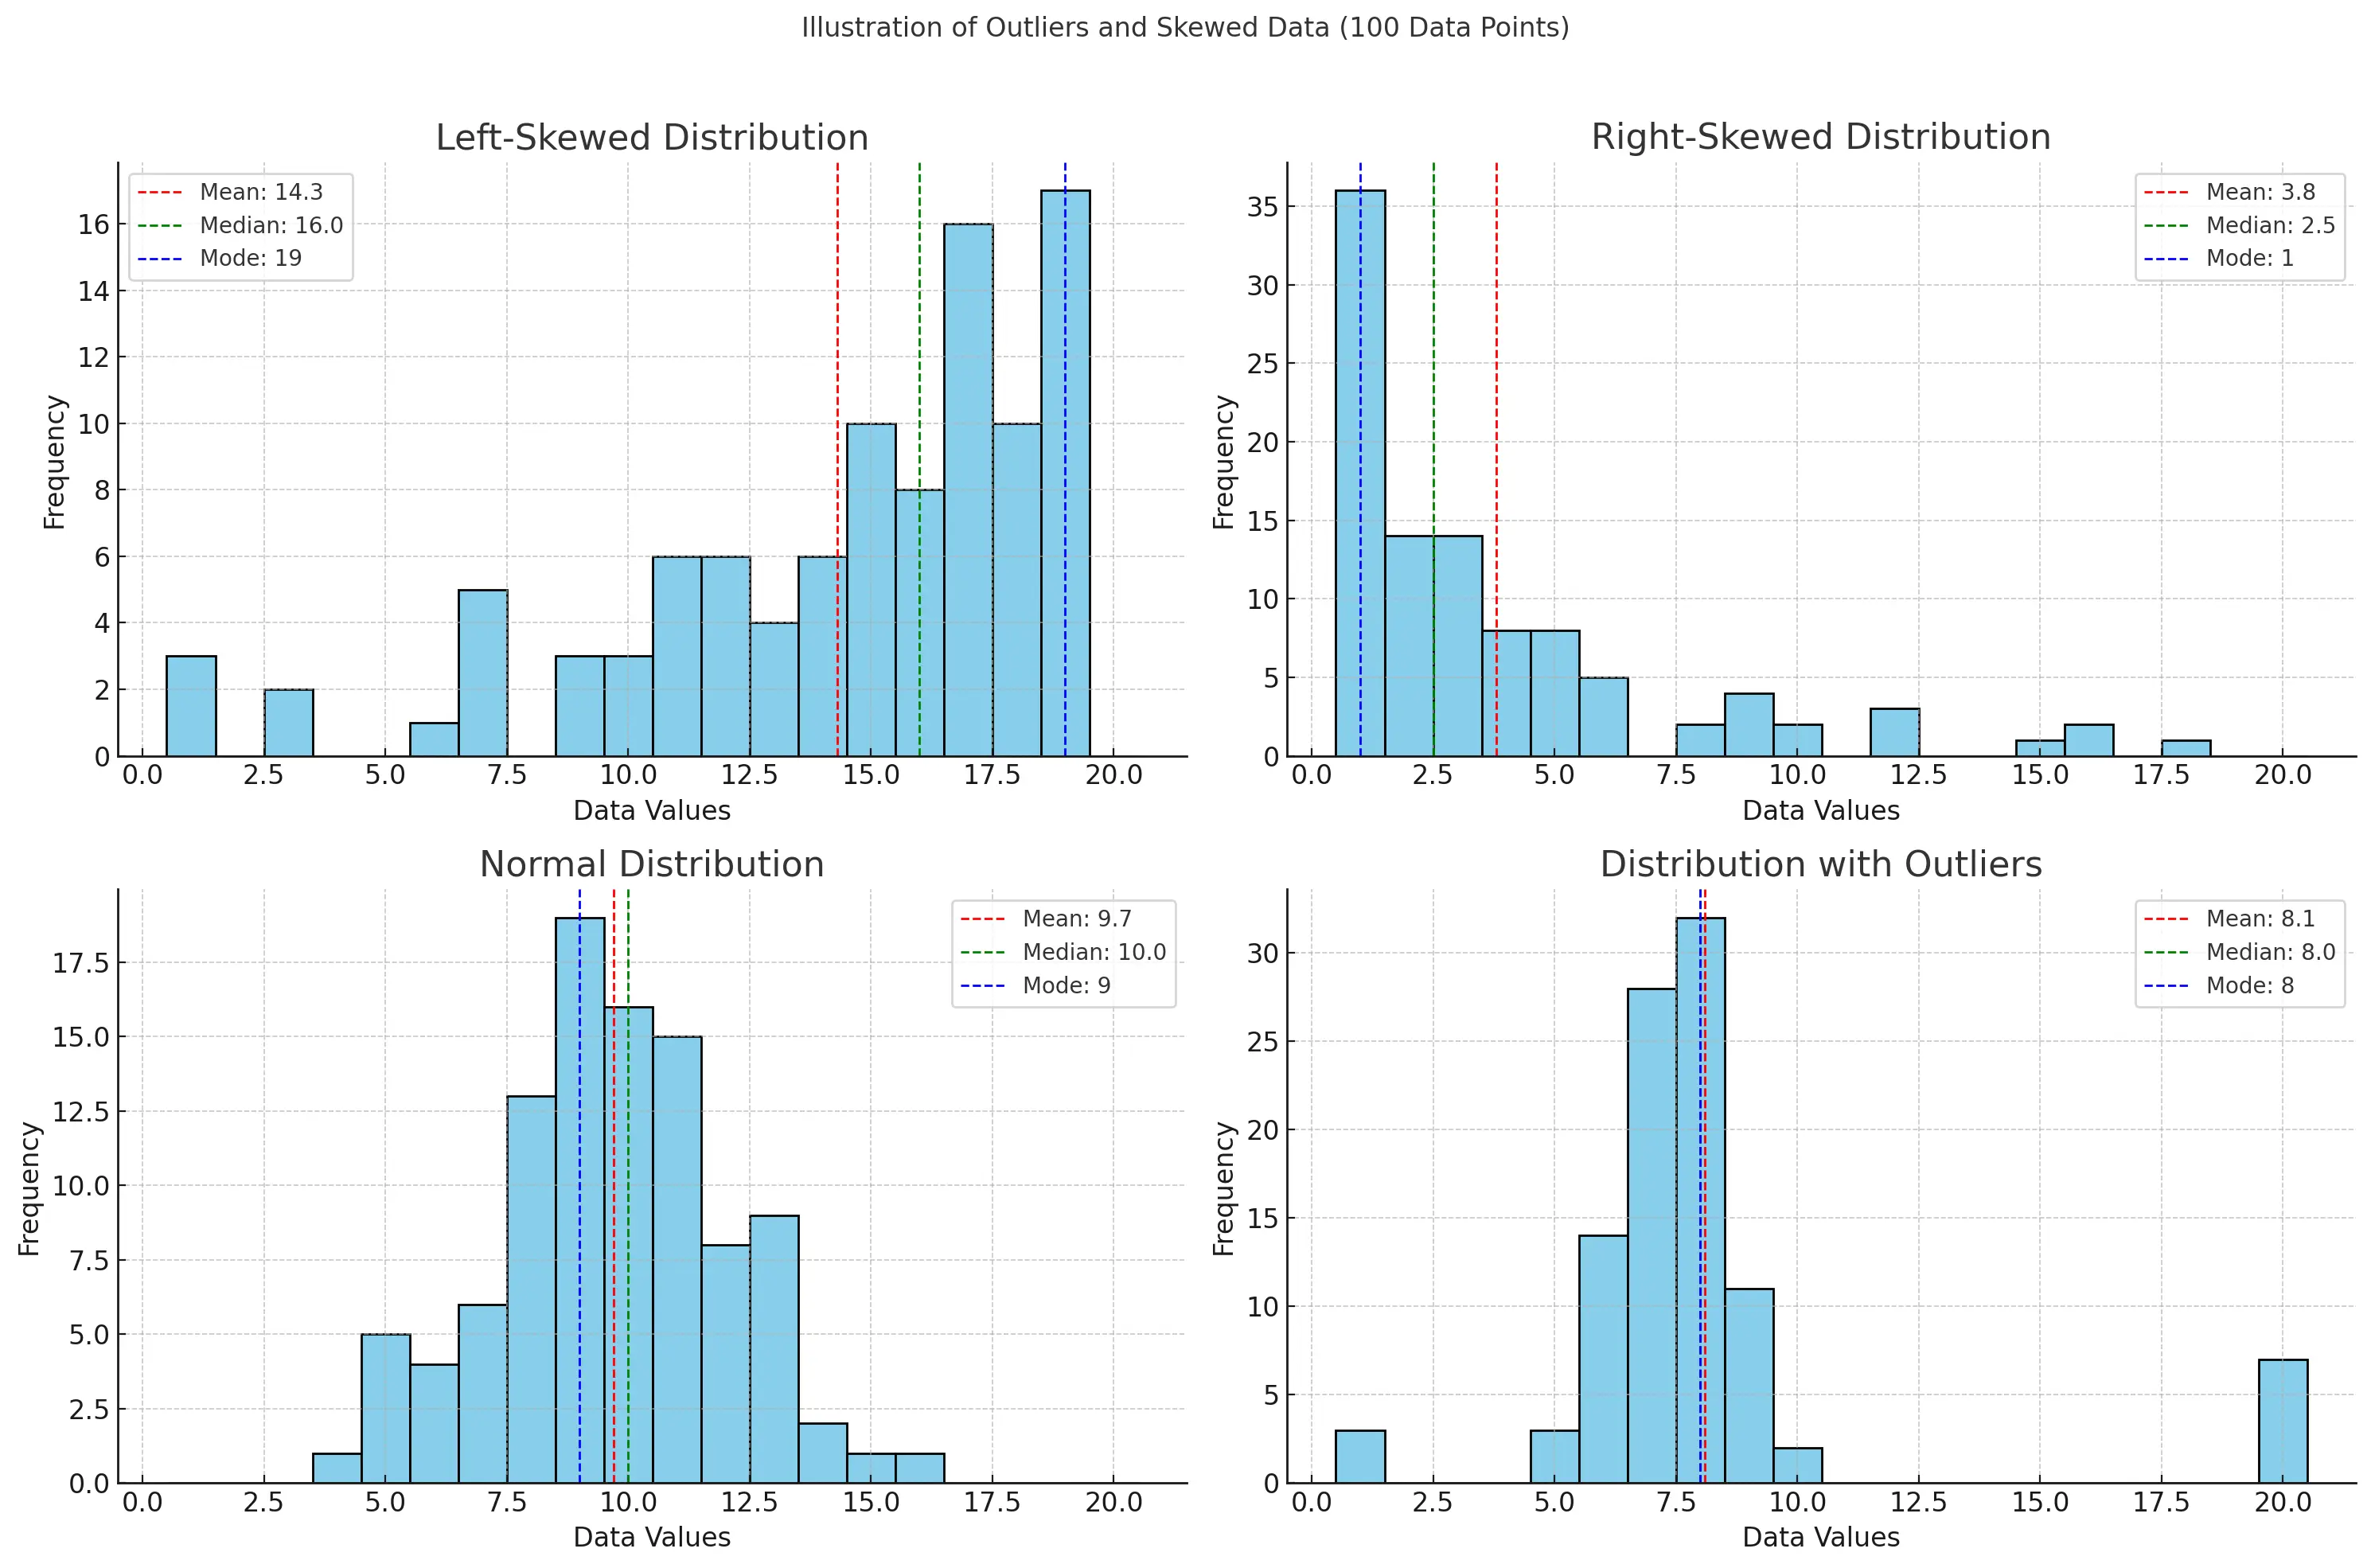
Impact of Data Distribution
Symmetric Distribution
In symmetric distributions, mean, median, and mode are typically equal or very close. The mean is usually the best choice here.
Mean = 3, Median = 3, Mode = 3
Skewed Distribution
In skewed distributions, extreme values pull the mean toward the tail. The median often better represents the typical value.
Mean = 26.3 (pulled by 100)
Median = 15 (more representative)
Data Type Suitability:
- Mean: Best for interval data
- Median: Ideal for ordinal data
- Mode: Perfect for nominal data
Impact of Outliers
Outliers can significantly affect the mean while having little impact on the median or mode. This makes the median particularly useful for datasets with extreme values.
Consider a dataset of test scores:
Regular scores: [85, 88, 90, 92, 95]With outlier: [85, 88, 90, 92, 95, 20]
Mean changes significantly: 90 → 78.3
Median changes little: 90 → 89
Advanced Statistical Concepts
Relationship to Distribution Types
In a normal distribution, mean = median = mode. Deviations from this equality indicate skewness.
Skewness Interpretation
When mean > median: positive (right) skew
When mean < median: negative (left) skew
Types of Means:
- Arithmetic Mean: For simple averages of absolute values
- Geometric Mean: For growth rates and ratios
- Harmonic Mean: For rates, speeds, and unit prices
- Weighted Mean: When values have different importance
Put Your Knowledge to the Test
Now that you understand the differences between mean, median, and mode, challenge yourself with real-world scenarios in our interactive quiz!
Formula Reference Sheet
Download our comprehensive formula summary with examples for mean, median, and mode - perfect for quick reference and studying!